


Instagram Stories is one of Instagram’s hottest features, providing users with quick, disappearing images and videos they don’t want to miss. With Stories, you can give your followers a behind-the-scenes look at your life beyond the polished face of your brand. Additionally, you can create fun, interactive content that keeps them coming back for more.
Part of Instagram Stories’ appeal for users is being able to see who is viewing and interacting with their Stories. Not only can you see who views your Stories, frame by frame; you can also study the analytics behind your Stories to see which ones engage your audience and which don’t. This provides you with valuable insights into what content is working in your Stories, and what you might need to adjust.
Wondering how to get started with Instagram Stories analytics and to see who viewed your Stories? This post will go over everything you need to know and how to use this information to improve your campaigns moving forward.
Why Does It Matter Who Viewed My Instagram Stories?
Knowing who viewed your Instagram Stories means that you can see who your audience is (or who your clients’ audiences are), and what they’re engaging with in your Stories feed. Beyond that, you can see who is engaging most frequently, what content they’re watching from beginning to end, and what they’re interacting with.
If you know what content your audience is interacting with and watching from start to finish, you can duplicate that type of content for future Stories. But if certain segments of your audience drop off after a first or second Story, you can immediately see which content wasn’t relevant to them.
Knowing who views and interacts with your Instagram Stories can give you valuable insights into the information you’re delivering, and who it’s going to. You don’t want to attract the wrong audience with content that isn’t truly relevant to your brand. Therefore, it’s important to keep up with who viewed your Instagram Stories so that you can make effective adjustments to the content you’re putting out there.
How to See Who Viewed My Instagram Stories
Wondering how to see who viewed your Instagram Stories? It’s super simple inside the Instagram app.
Stories viewer lists are only visible during the 24 hours that a Story is visible, then an additional 24 hours afterward. Viewer lists and view counts are only available for 48 hours total, so if you want to know exactly who sees your Instagram Stories, you will need to keep a close eye on your analytics in your account daily.
To get to the viewer list from a current Story, simply tap into your Instagram Stories and swipe up.
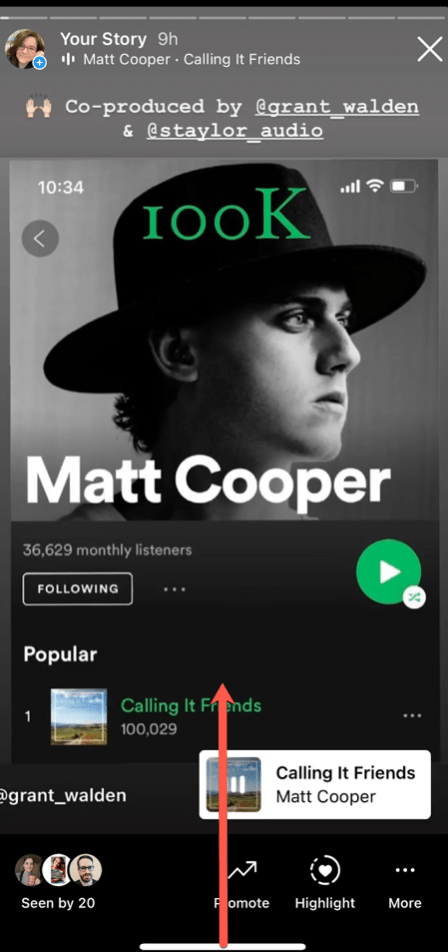
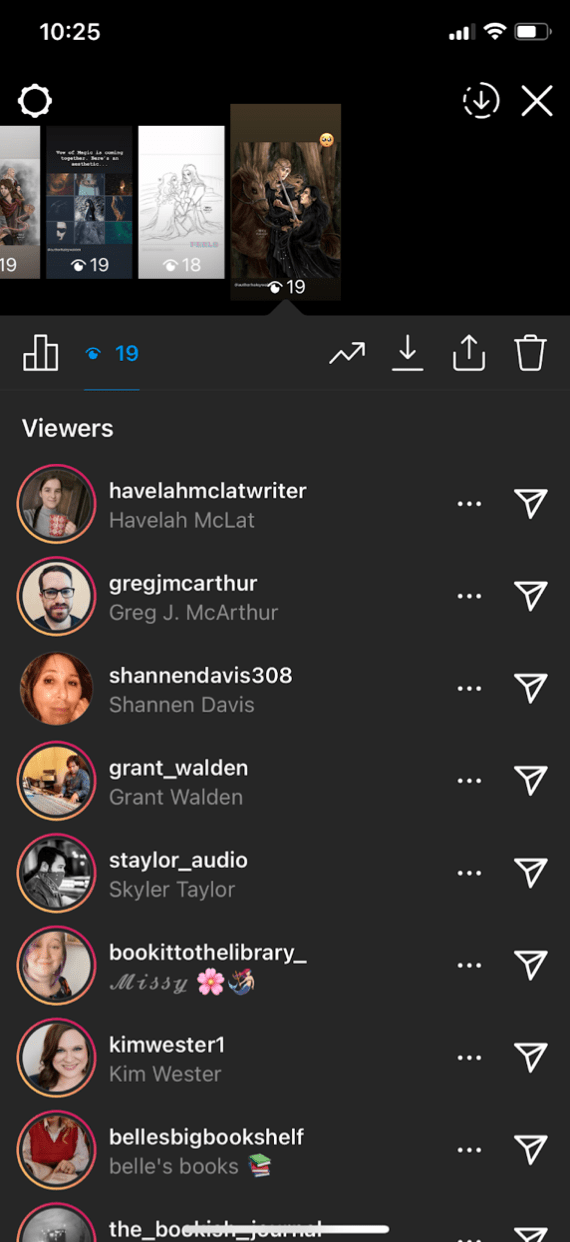
You’ll immediately see an option to choose between your analytics and your viewer list. Click the eye icon and you’ll be able to see your list of viewers.

At the top of your screen, you’ll see that all your current Stories are displayed horizontally. You can tap on each Story to see viewer lists, making it easy to see who watched your Stories all the way through, and who dropped off.

If you leave the Insights screen up, you can swipe across, then tap on the other Stories you’re interested in seeing. Viewer counts display on each thumbnail.
As you select the Stories you want to analyse, note which ones got more views than others, and what types of content they contain. You’ll want to keep that in mind for future Stories you post to your feed.
Instagram Stories Analytics
There are two ways to view your Instagram Stories Analytics inside the Instagram app. The first is by tapping on your current Stories from your profile, exactly how we tap to see our viewer lists. Once you’ve tapped your Story, swipe up from the bottom of the screen and tap the graph in the upper left corner.
Your Insights screen will show you an overview that includes information about the number of accounts reached, content interactions, audience, and content you’ve shared over the time period you’re studying. You’ll be able to get a good idea of:
- How many actions were taken from your Story
- Whether it resulted in any profile visits or replies
- How many accounts were reached
- Whether you got any new follows from a Story
- How many of your total viewers navigated through all your Stories, how many dropped off, and how many exited after viewing the one you’re looking at
It’s also possible to check a limited amount of your Instagram Stories analytics from the Insights button on your Instagram profile. Because much of the Stories analytics information disappears after 48 hours, you’ll only be able to see a small amount of information. However, you can still get an idea of which of your posts perform the best.
First, tap the Insights button on your Instagram profile. That will take you to a dashboard that allows you to view your recent highlights from either the last 7 days or the last 30 days. Select what time span you’d like to view, and the mobile app will adjust the data it displays on your screen.

If you scroll down the page, you’ll see options to view analytics for your recent Posts or Stories. Tap Stories to see your Instagram Stories analytics.

Once you’re inside the Stories screen, you can choose whether to view stories from the last 7, 14, or 30 days. Select your time span of choice.

Select the Story you’d like to analyse. Like your live Stories, you’ll want to swipe up from the bottom of the screen, and you’ll see the insights window for that specific Story.
Instagram Stories Metrics
From your main Stories analytics screen, you can select specific Metrics to study. Let’s take a deeper dive into your options.


Back
Your Back analytics measure which Stories users clicked on, then navigate backward to see the previous Stories before it. High numbers of Back users on a Story indicate that it was interesting and engaging enough for the viewer to go backward and see what you posted before.
Call Button Taps
The Call Button Taps metric gives you a snapshot of how many people have tapped the Call button on your Profile from a Story.
Email Button Taps
Email Button Taps in Instagram Stories measures how many users have tapped the Email button on your profile from a Story.
Exited
If users have Exited your Stories at a certain point, then your content isn’t holding their attention any longer. Pay close attention to whether there’s a pattern to users exiting your Stories, and try to weed out types of content that may not be resonating with them.
Follows
The Follows metric measures which Stories you got the most follows from on your profile. Is there a particular type of content or call to action that’s driving that action?
Next Story
Your Next Story metrics give you a clear look at how many viewers are tapping through from one Story to the next. That means your content is holding their attention, and they’re excited to see more in many cases, though they may also be rushing through to see what’s next; compare this to Exit rates and other engagement metrics to make sure.
Get Directions Taps
This metric will show you how many accounts followed your Story to the Get Directions button on your profile, then tapped on it. That means users clicked to get directions to your physical location.
Impressions
The Stories with the most impressions are your top-watched Stories. This means you’ve reached more accounts with these particular Stories than with others you’ve posted from your account.
Link Clicks
For links included in an Instagram Story, business accounts can see how many link clicks they received in any given story. The Stories with the highest number of clicks can be emulated in future content.
Forward
Forward metrics mean a viewer clicked through to the next Story. Take a look at your Stories with the highest number of Forward clicks to get an idea of what’s keeping your audience interested in the Stories you share.
Profile Visits
The Profile Visits metric means users are clicking through to visit your profile from a particular Story. Take a look at the Stories content that people are coming to your profile from. Is there a particular pattern you can emulate for next time?
Reach
A Story’s Reach encompasses the total number of accounts and actions that stem from one Story. This includes impressions and all navigation actions.
Replies
The Replies metric gives you an idea of how many people replied to your Story. Taking a look at your top-performing Stories for replies will give you a clear idea of what kinds of content encourage your followers to send you a direct message.
Shares
The Shares metric reveals how many of your Story’s viewers shared it, either via direct message or to their own Stories.
Text Button Taps
The Text Button Taps metric measures how many of your Story’s viewers tapped a button included in your text, such as an @mention.
Website Taps
This metric lets you know who headed to your profile from your Story to visit your website. It’s valuable to know whether you’re driving traffic off-platform, so you can get a feel for the content and information they’re most interested in.
Story Interactions
Story Interactions measures your top engaged Instagram Stories. They’re the Stories where the most actions were taken, including direct-message replies and profile visits. This metric essentially aggregates all the interactions with your Story, then ranks each one based on its total interactions.
Carefully consider the Stories that appear highest in your Story Interactions list, and create more content like this. Experiment with using Stickers, interactive content, and links to see what performs best. You can use these highly engaging Stories to drive conversation around your brand, and drive your followers to take specific action.
Third-Party Tools for Stories Analytics
If you’re looking for expanded Stories analytics information on an at-a-glance interface, there are a few third-party tools available that allow business owners to get a clear picture of how their Stories are performing. Here are two of the most powerful tools available.
Later
Later is a third-party social scheduling platform that features Instagram Stories scheduling, in addition to detailed analytics on your Story performance. The app displays all your Stories analytics in one place so you can easily compare Story performance over a period of 7, 14, or 30 days.

Inside Later’s analytics dashboard, users can view a Detailed Story Performance report. The report features an easy-to-analyse grid that features recent Stories posted within your selected time frame. You can sort the grid by Impressions, Reach, Replies, Back, Forward, Exited, Completion Rate, and Average Views / User.

The grid uses a color-coding system to indicate Story performance, from low to high, making it simple to determine which Stories performed best. You can analyse Story performance according to each metric, which will help you to determine which types of content to duplicate.
Later for Business pricing starts at $12.50 USD per month and scales up from there, based on the number of social profiles you need to connect to your account.
Sprout Social
Sprout Social is a social scheduling service with powerful analytics capabilities. Its detailed, data-driven dashboard provides you with deep insights into Story performance and what’s resonating with your audience.

Sprout Social’s Instagram Stories analytics are a detailed, deep-dive into exactly what’s happening with your Stories. You can view a general overview of your Story performance in Sprout’s Sent Message dashboard, or in the Instagram Profile Report. The report contains a visual graph, plus specific metrics, totals, and growth percentages. Sprouts metrics include Story Replies, Story Taps Back, Story Taps Forward, Story Exits, Story Impressions, and Average Reach per Story.
As far as pricing is concerned, Sprout Social starts at $99 USD per month and scales from there, depending on the number of profiles you need to connect.
Final Thoughts
Being able to analyse insights from your audience is important, not just in Instagram Stories, but on your website and all your social media platforms. When you know what content is resonating with your audience, you can keep providing more of that.
Serving up the right content, via Stories or otherwise, means broader reach and growth for your brand and for the clients you serve.
%20(3).png)

.png)
.png)


