

If you’re wondering how your Twitter account and its campaigns are performing, you can find out using Twitter Analytics.
Twitter is an engagement-driven platform focused on short-form content and ongoing dialogue between users. In otherwords, it’s all about what’s happening right now and conversation around that.
Because of this, it’s a great tool for businesses that want to maintain a more casual, back-and-forth conversation with their audiences.
The key to Twitter is knowing which conversations are most effective for your brand. That’s where Twitter Analytics comes in.
Knowing your analytics will help you better understand your audience. And, even better, you’ll be able to use that knowledge to fine-tune your social media strategy going forward.
Let's take a look at how to use Twitter Analytics to learn about your audience and your campaign performance.
What is Twitter Analytics & Why Does It Matter?
Twitter Analytics is a native tool available to all Twitter users. It provides insights that help you stay on top of your account’s performance.
With Twitter Analytics, you can keep an eye on how your Tweets are performing. Additionally, you can monitor impressions, mentions, followers, and profile visits over a given period of time.
Twitter Analytics provides you with a deep understanding of the impact your presence is making on the platform. Which Tweets are getting the most engagement? Are there specific hashtags that boost your performance? Do your followers respond better to one kind of content over another?
When you understand what content performs best on Twitter, you can adjust your strategy accordingly. Studying the analytics on any given social media platform will give you the tools and knowledge you need to position yourself for better growth.
No matter what social media platforms you choose to post from, it’s important to understand how your content is performing. You need to know about the engagement, reach, and impressions your account is getting so you can make adjustments to what you post from one month to the next.
Who Gets Access to Twitter Analytics?
Twitter Analytics is free to everyone with a Twitter account. It’s a native tool, which means it’s built into the platform.
You don’t need a special business account in order to access Twitter Analytics. Its insights and tips for growth and engagement are easy to use and accessible to all accounts. This means that if you have a Twitter account, you can start getting analytics data on its performance right now. You can access it both on desktop and on mobile, but make sure that your app is up-to-date if you’re not able to find it on mobile.
How to Access Your Twitter Analytics
It’s easy to access your Twitter Analytics dashboard. Let’s take a look at how to view it.
First, head over to your Twitter homepage. From the left-hand navigation menu, click More.

This will open a larger drop-down menu. Find “Analytics†and click on it.
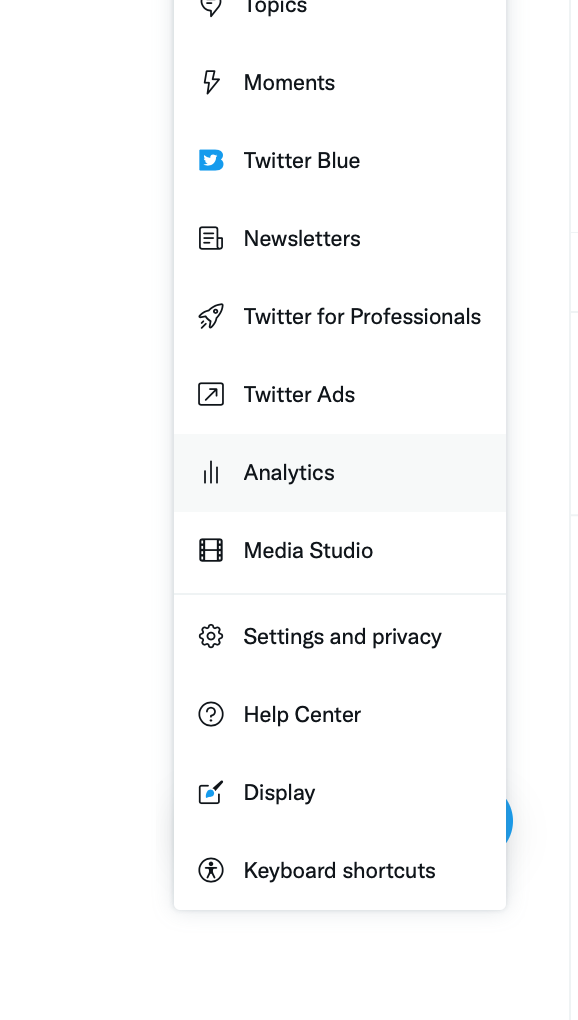
From there, you’ll be taken to the Twitter Analytics dashboard. The first thing you’ll see is the Account Overview, where you can start exploring your insights. You can navigate through the Analytics by either clicking on “Tweets†or “More†to see additional options.

How to Navigate Twitter Analytics & What You Can Learn
Navigating Twitter Analytics is incredibly straightforward. The dashboard can teach you valuable information about your account’s performance at a glance.
Let’s break down all the insights you can gain through Twitter Analytics and where you can find them.
Analytics Home & Overview
Your Analytics Home & Overview page gives you a big-picture look at how your account is performing overall. The first thing you’ll see is a 28-day summary of your account, which will give you a quick snapshot of the past month.

Your summary includes the following insights:
- Tweets, which gives you a look at how many times you’ve Tweeted over the past month
- Tweet impressions, which reveals the total number of times your content has been seen (not: this is NOT the same as reach, which tells you the number of individual users who have seen your content)
- Profile visits, which shows how many visits your profile has received within the set time period
- Mentions, which reveals how many times your account has been mentioned through tagging via others
- Followers, which reveals whether you’ve gained or lost followers (and how many)
With all of these analytics, you’ll see numbers and trends compared to the previous period of time. This can be essential to help you keep track of your performance month-to-month.
If you’re losing followers, for example, that’s a red flag— have you posted less often, or more controversial content as a brand? If so, that may be the cause. Some users will also unfollow brands that only seem to share links to their blog content without explaining why you should click, as opposed to engaging in conversations. This is an outstanding way to track progress and troubleshoot issues.
Month-to-Month Breakdowns
Below your initial summary on the analytics home page, you’ll be able to view summary statistics from this month and from previous months. You’ll be able to see your top follower for each month, in addition to top mentions, top media Tweets, and tips for improved performance.

These insights can be exceptional. You can get an idea of who your most valuable followers are, and look for opportunities to leverage that connection to start a conversation that has a better chance of gaining traction.
You can also see which mentions were the most significant to your brand, which can give you a good idea of what your audience may be interested in.
If you haven’t yet Tweeted this month, you’ll get a prompt to do so straight from the analytics dashboard. You might get tips for how to grow your followers. Additionally, you might see prompts on how to share multimedia, or how to promote a Tweet for further reach.
Tweet Activity
Your Tweet Activity section is a tab that gives you a deeper look into your recent Tweets and how they’re performing. Users can change the date range in order to view performance over different time periods. It’s also possible to export your data from here.
This page will display graphs that reveal impressions over any given period of time. You can toggle the main graph between Tweets, Top Tweets, Tweets and Replies, and Promoted Tweets to see how each category is performing.
In addition to how many total impressions you’ve received over the past 28 days, you can see your average impressions per day. You can also view total engagement percentage, link clicks, and Retweet stats from this part of the dashboard.

The Tweet Activity page is a great place to break down how your content is performing, down to each post. This is incredibly important if you’re serious about growing your Twitter following and boosting your account visibility, engagement, and reach.
When you select a given period of time, you can view how your individual Tweets performed during that time. You’ll be able to see the engagement rate for every Tweet, as well as the number of impressions and engagements for each.
Video Activity
On your Video Activity page, you can take a closer look at how your video content has been performing on Twitter. Again, this page allows users to look at the past 28 days. You can also look back at previous months’ content.
If you regularly post video content to Twitter, you can see a graph of the video activity from your account. You can see how many views your videos have earned, as well as how many videos you’ve published during any given time period.

When it comes to posting video on social media, it’s important to know whether your followers are actually spending time with your content. On this page, you’ll be able to see how many views each of your videos gets. Because video completion is so important, Twitter shows you the rate of completion on each video.
The completion rate metric is particularly important; it can tell you if your content is engaging enough to keep a solid portion of your audience captivated. And since many videos have CTAs at the end, you want users to be making it to the end of the video, especially since Twitter videos are so short. (Most users can only upload videos of 140 seconds or less; some can get access to post videos up to 10 minutes long.)
You can toggle between viewing all the videos you’ve posted in a month, or only looking at promoted video stats. Twitter also shows you your total number of video minutes viewed in a selected month, plus viewer minutes per day.
Like the Tweet Activity page, you can export your Video Activity data from here. This can be useful if you need to send reports to clients or managers to show progress on existing or past campaigns.
What About Third-Party Analytics Tools?
It’s possible to combine your insights from Twitter Analytics with third-party analytics tools. There are plenty of third-party social media publishing, management, and analytics tools that make this process simple and straightforward.
The native Twitter Analytics works plenty well and gives you most of your core information. Simply studying the data you gather from the native tool will give you a leg up on your strategy.
In short, Twitter Analytics is an excellent tool, but you can explore others if you want to increase the data that you’re getting in some way. Some other platforms may have additional information and features that help you take your analytics to the next level.
For example, hashtags are important to Twitter engagement. Tools such as Agorapulse can show you your top-performing hashtags. You can also view a “hashtag cloud†that features both top hashtags and interactions, which you can expand and explore through the platform.

Agorapulse allows users to export their top hashtags, in addition to their metrics. This ability can be useful if you’re building a repository of hashtags to organise for your social media strategy. You can also research these hashtags on other platforms, such as Instagram, to see how they perform and reach there.
Semrush, on the other hand, helps users compare their Twitter activity to competitors. In addition to revealing hashtag analytics, this third-party platform lets users analyse what their competition is doing on Twitter.

If you’re interested in deeper market research and want to know what your top competitors are up to on social media, then a tool such as Semrush can help consolidate that information in one place.
There are a number of different third-party platforms out there that offer unique features when it comes to analytics, you just need to decide if it’s worth the price tag that comes with it. As a plus, most of these platforms either offer free trials or free demos so that you can make sure it’s a fit for you.
Final Thoughts
Twitter Analytics is a powerful, effective, and (perhaps best of all!) free way to dig deeper into your Twitter account performance. You can leverage this data to find out what your followers respond best to, then to make adjustments to your posting strategy.
Now that you know how to navigate the Twitter Analytics dashboard, it’s time to dig into your account’s data. With the right information in hand, it’s easy to respond to what you learn about your followers and your content’s performance.
If you’re looking for extra help in growing your Twitter expertise, take a look at SMC’s Twitter Marketing Short Course. This short, self-paced course is a way to rapidly boost your Twitter strategy. You’ll learn from top Twitter experts to fine-tune your content, as well as how to leverage analytics and data to get more reach and better engagement. Want to learn more strategies to help you get the most out of Twitter? Check out our Twitter Marketing Course.


Share:
How to Get Twitter Followers to Grow Your Social Following
How To Use Twitter for Beginners